006 : Data visualization
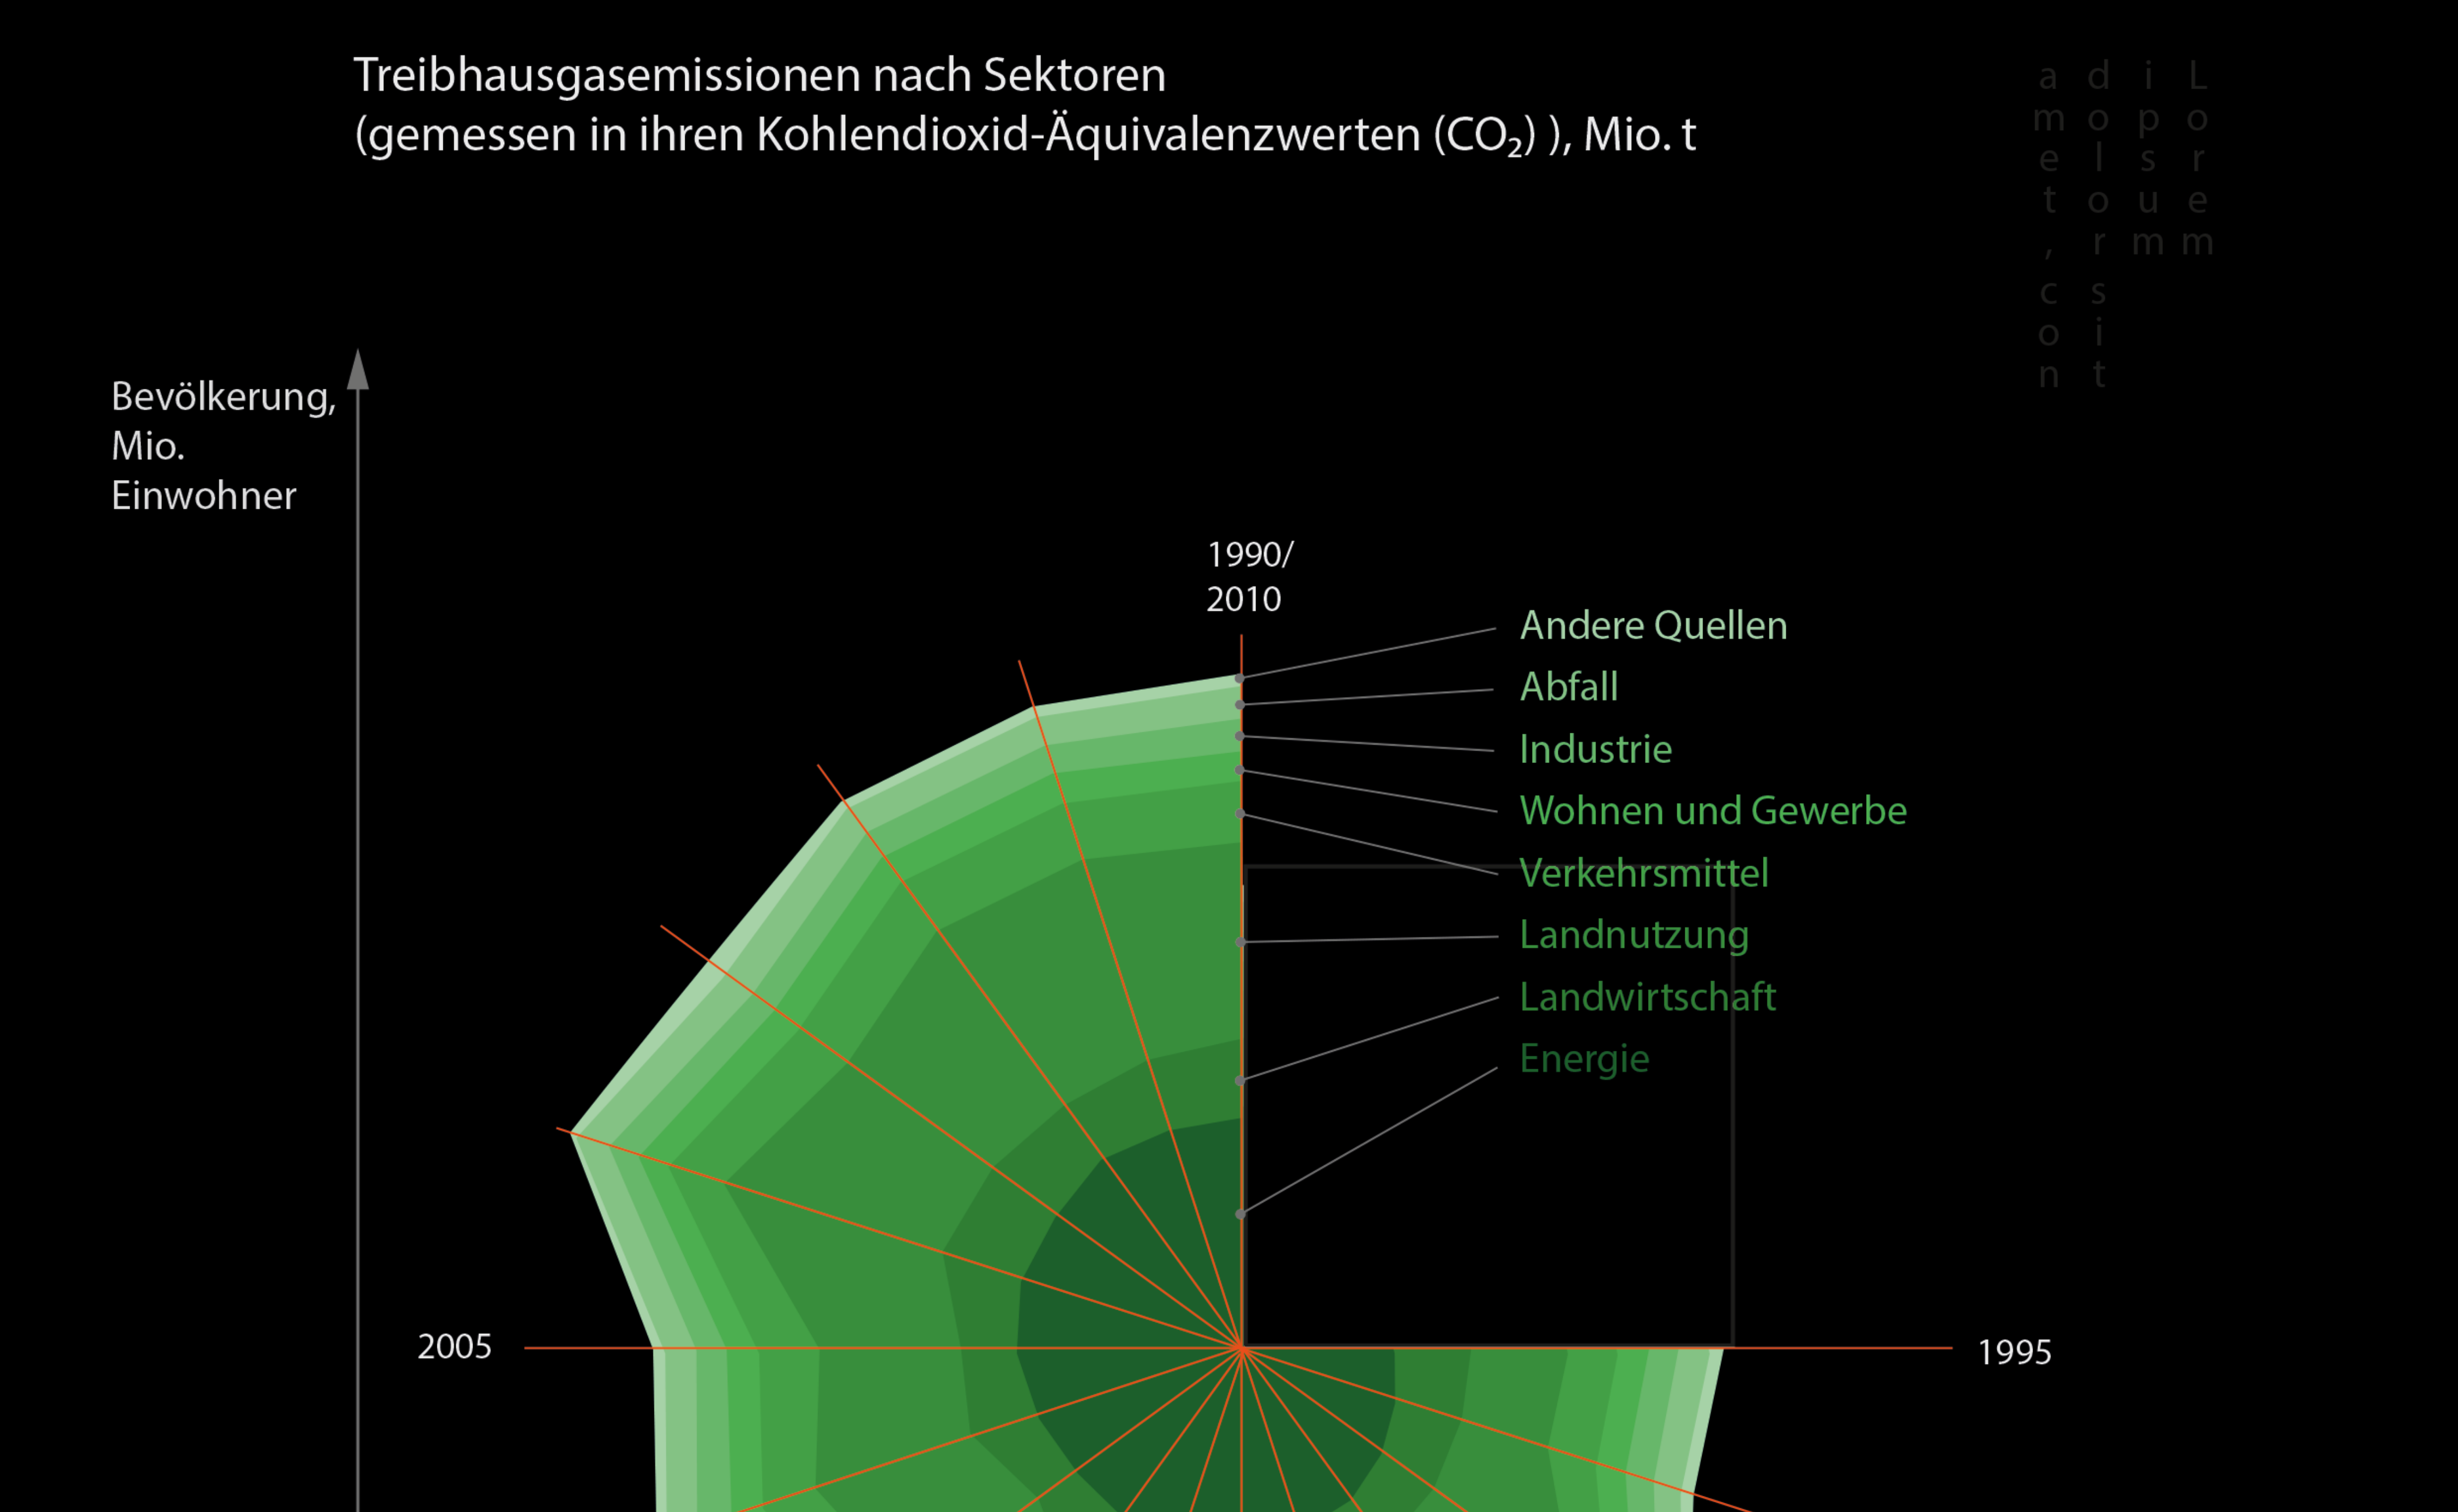
The first data visualization shows each continent and sector's greenhouse gas emissions from 1990-2010. The representation of the continents was set on a coordinate system and sorted by continental area and population. The horizontal data visualization shows a motorsports calendar with the eight motorsports series for the year 2020.

Greenhouse gas emissions by sector and continent.
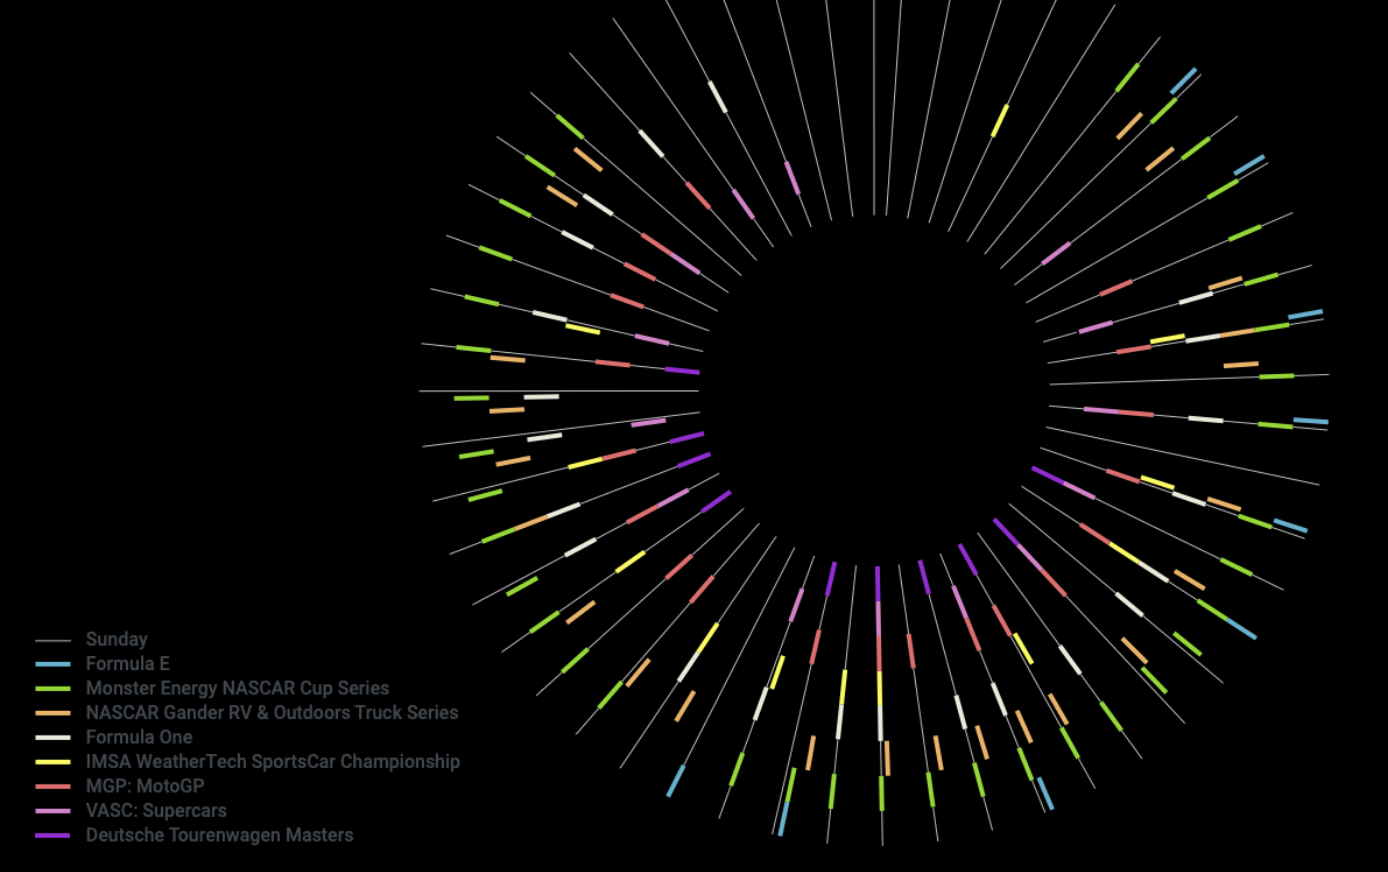
Motorsport calendar 2020 with a legend.